Show the limit before the lever
Technicians make better changes when the facility's constraints are on screen first. Context turned settings from guesswork into decisions.
Case study · Infrastructure software · Bitcoin mining
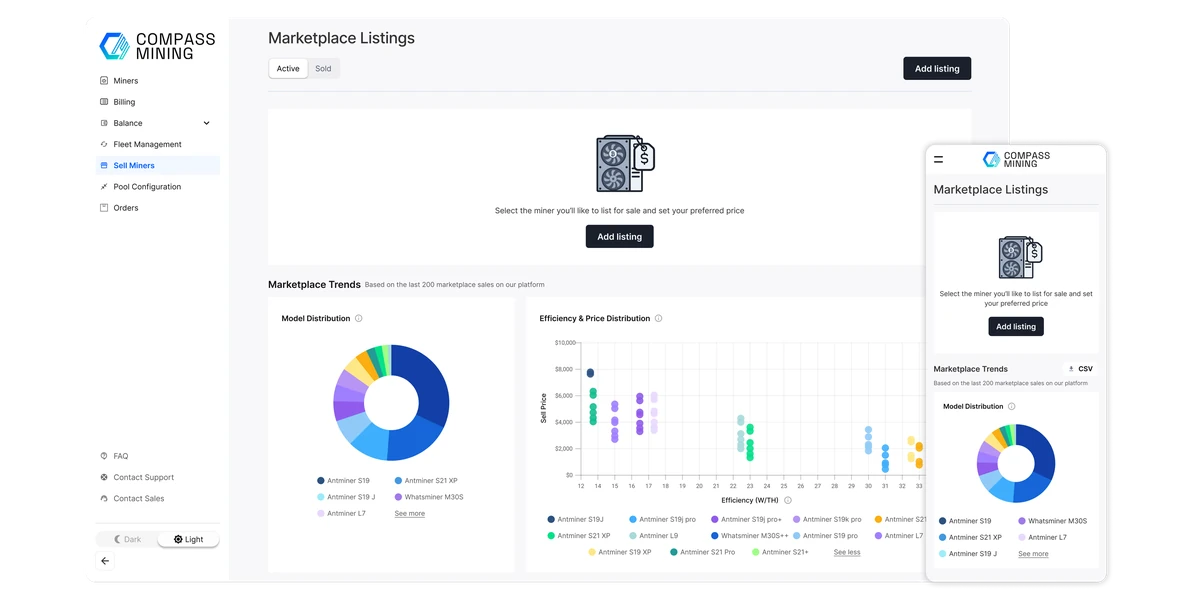
SHAMan is the platform Compass Mining's technicians use to run their facilities. I redesigned two of its core workspaces: Facility Settings, where power and network rules are set, and the Issues overview, where problems across thousands of miners come into view.
The problem
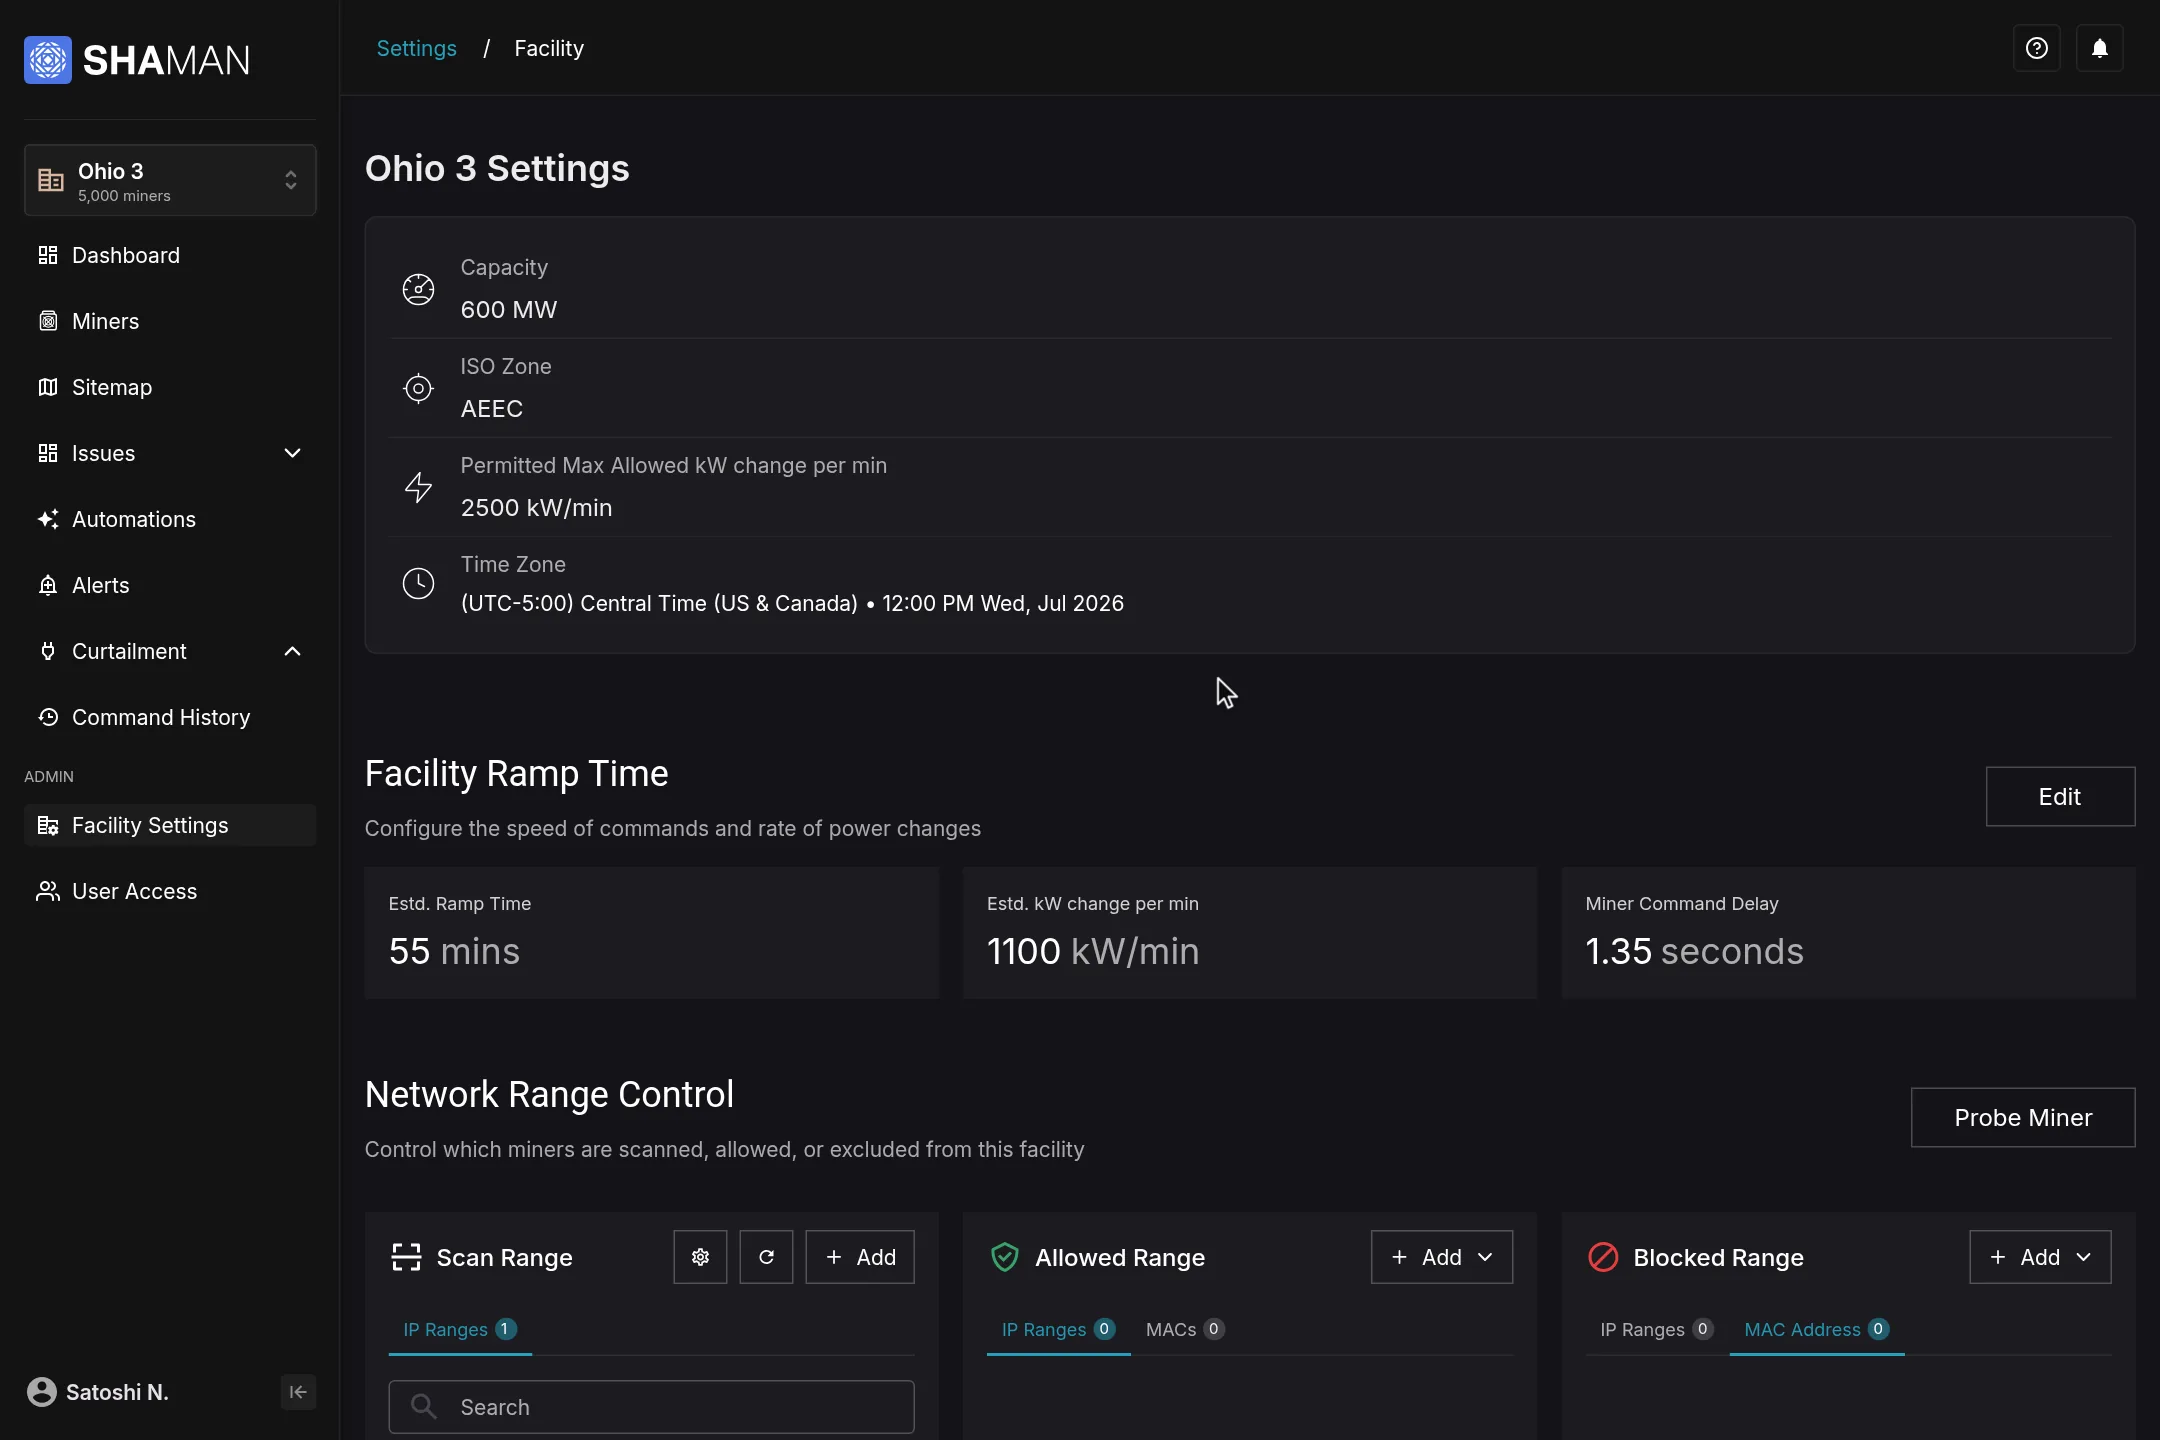
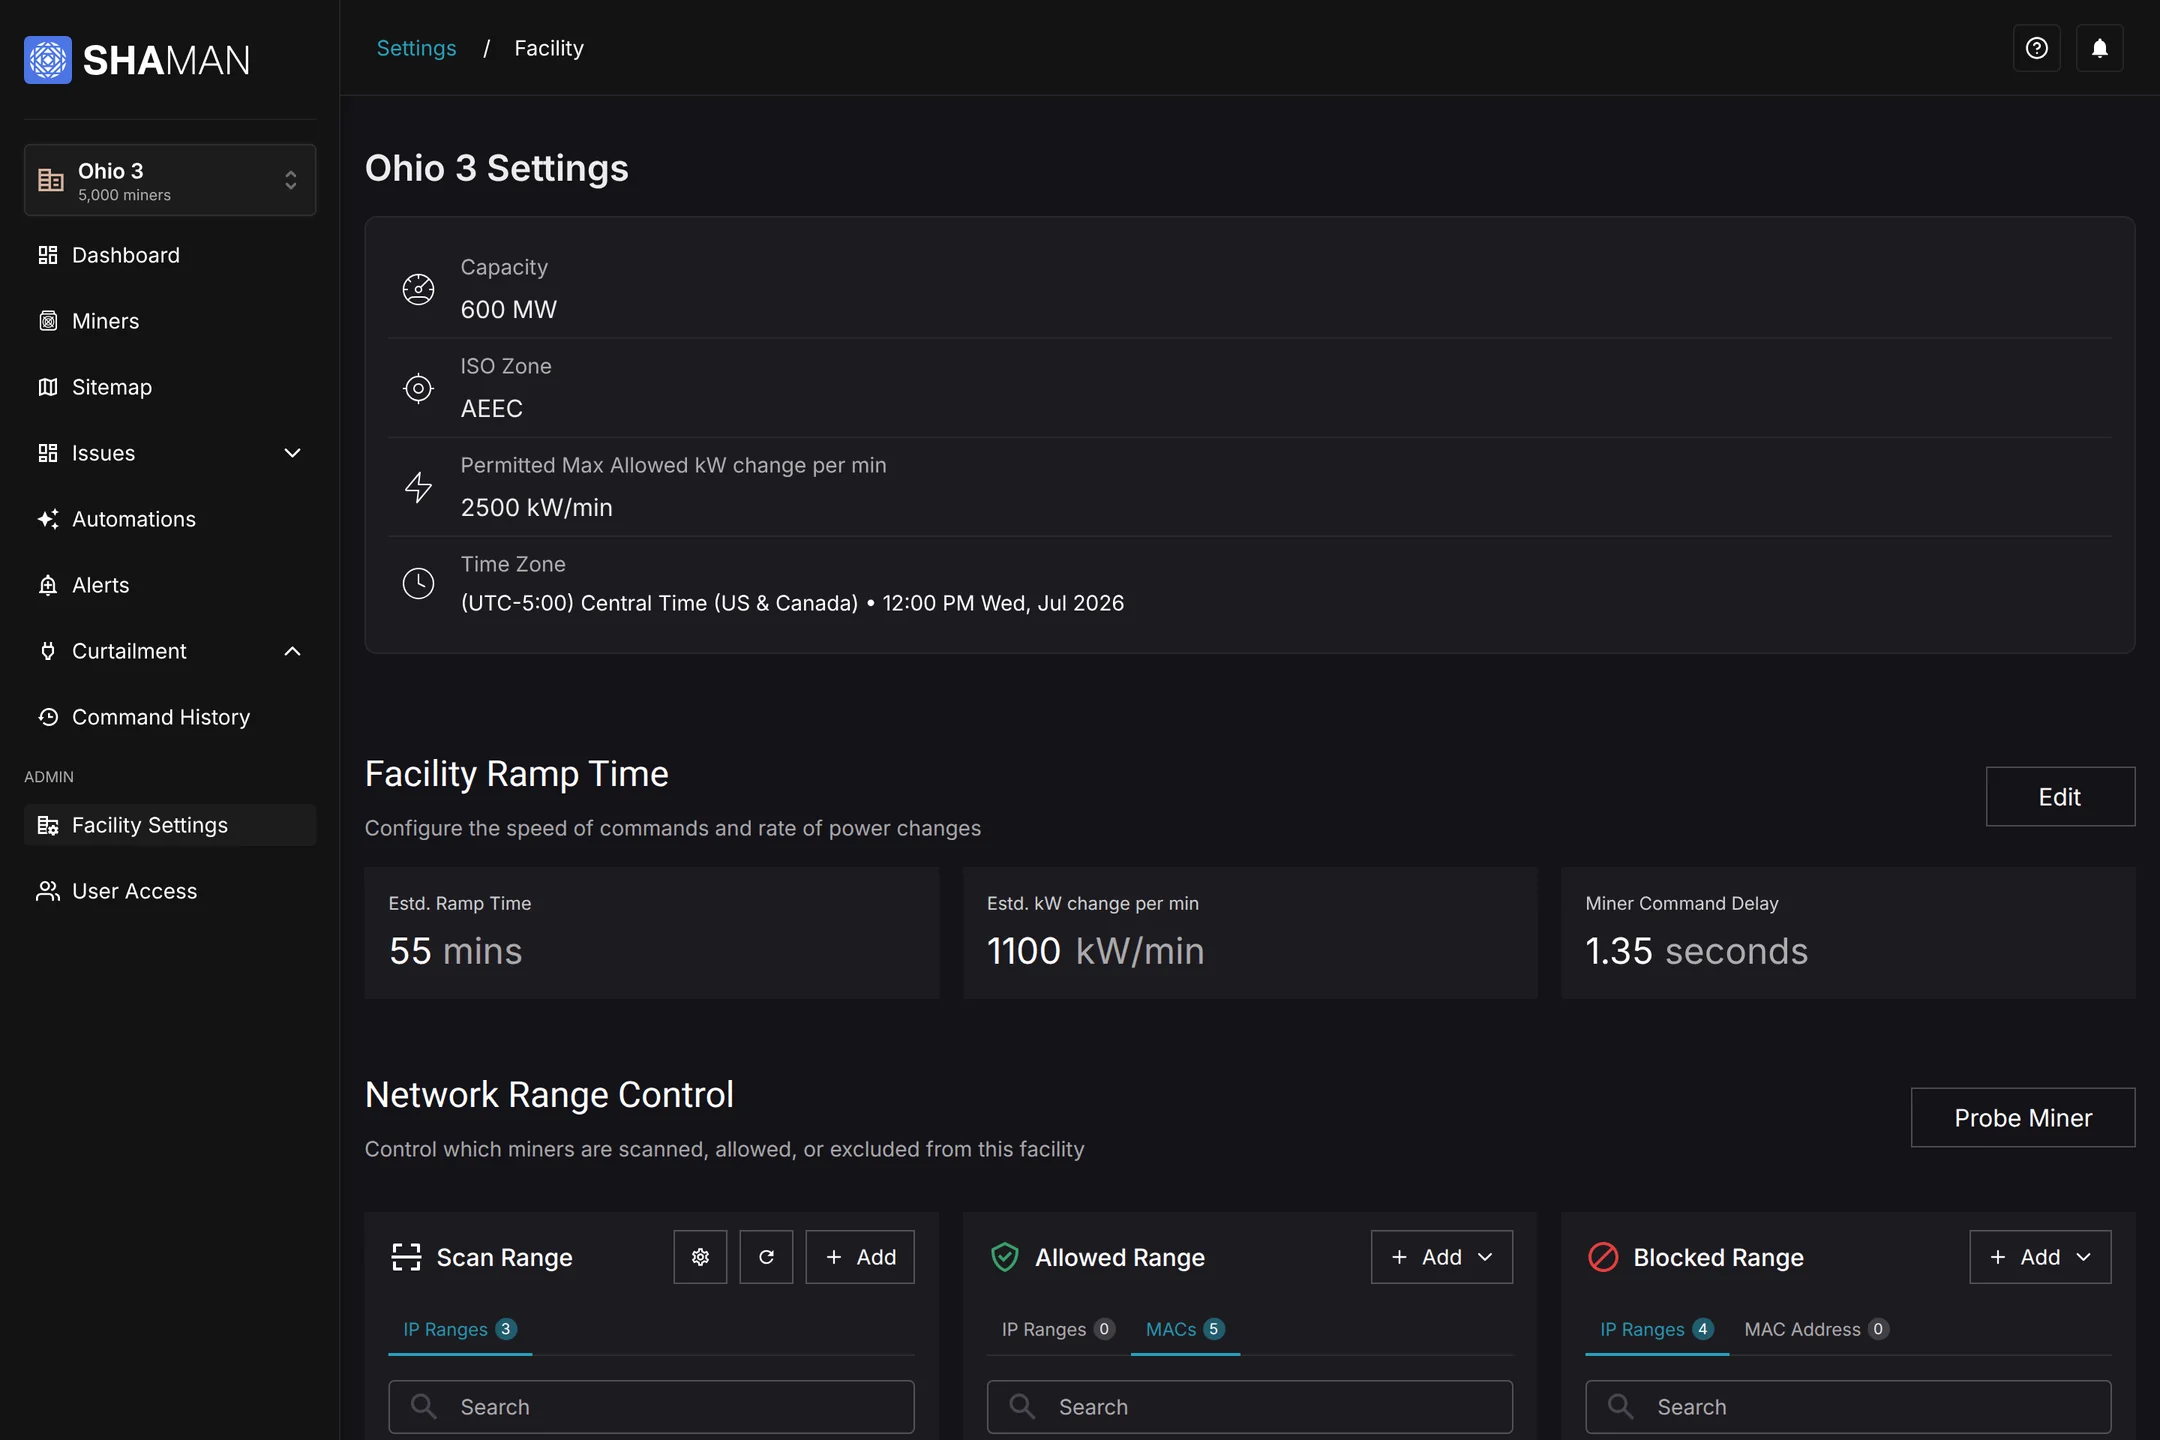
SHAMan already had the data and controls to run a facility. But Facility Settings was inherited from an earlier version, and new backend capabilities had never reached the screen.
What I did
Restructured Facility Settings around power and network control, and designed an Issues overview for spotting problems across every facility.
The approach
Show a facility's limits before its controls, connect settings to their consequences, and always answer where a problem physically is.
The challenge
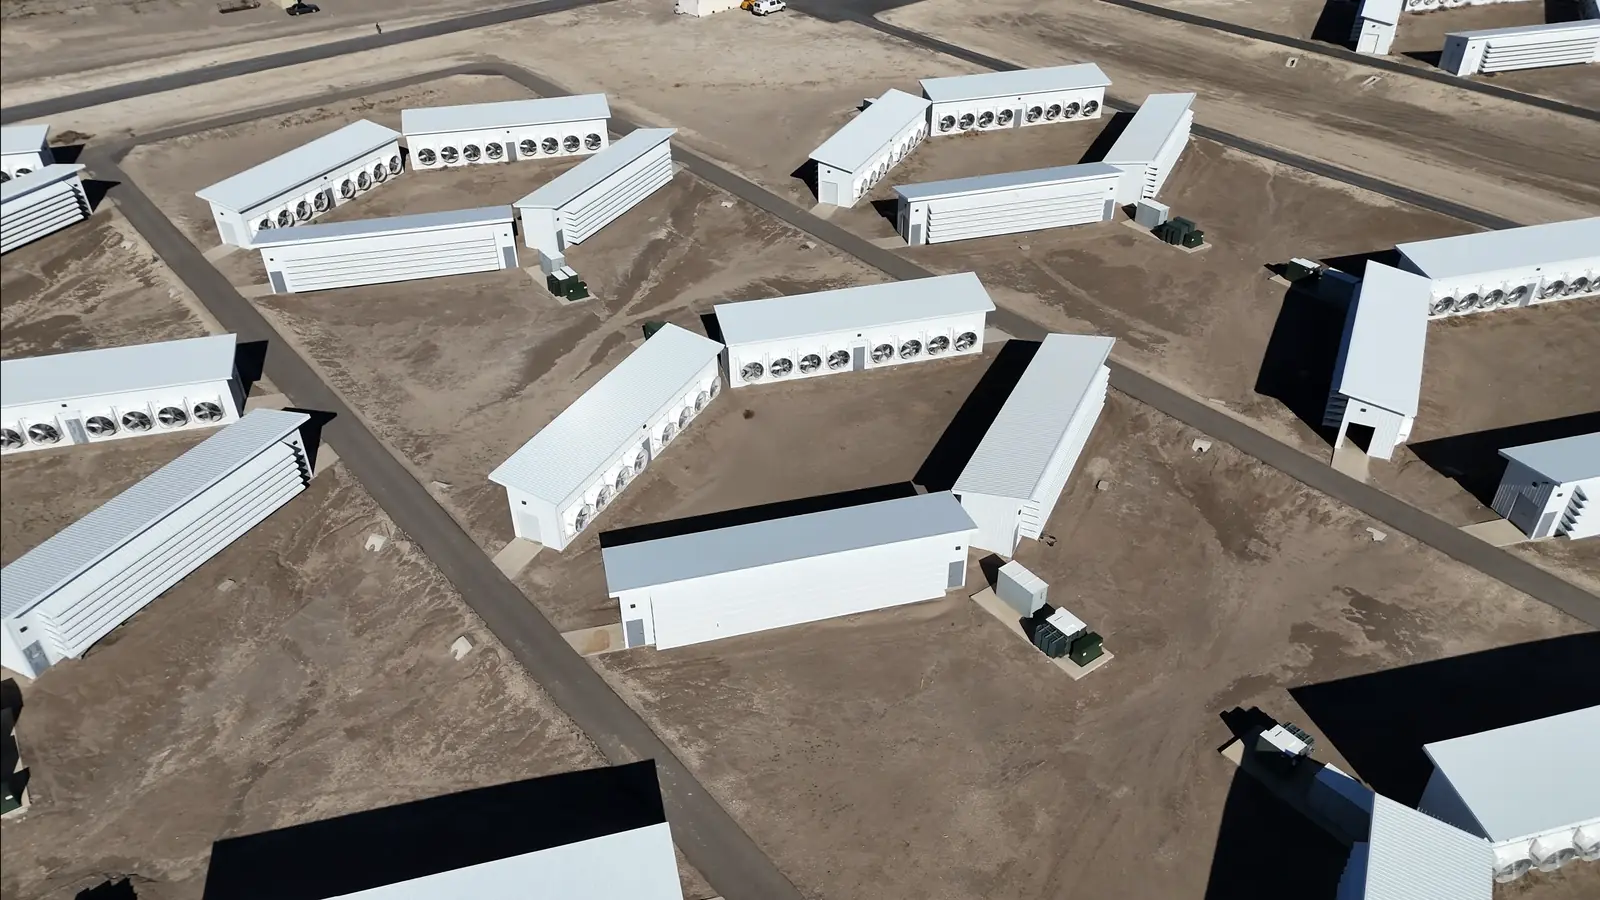
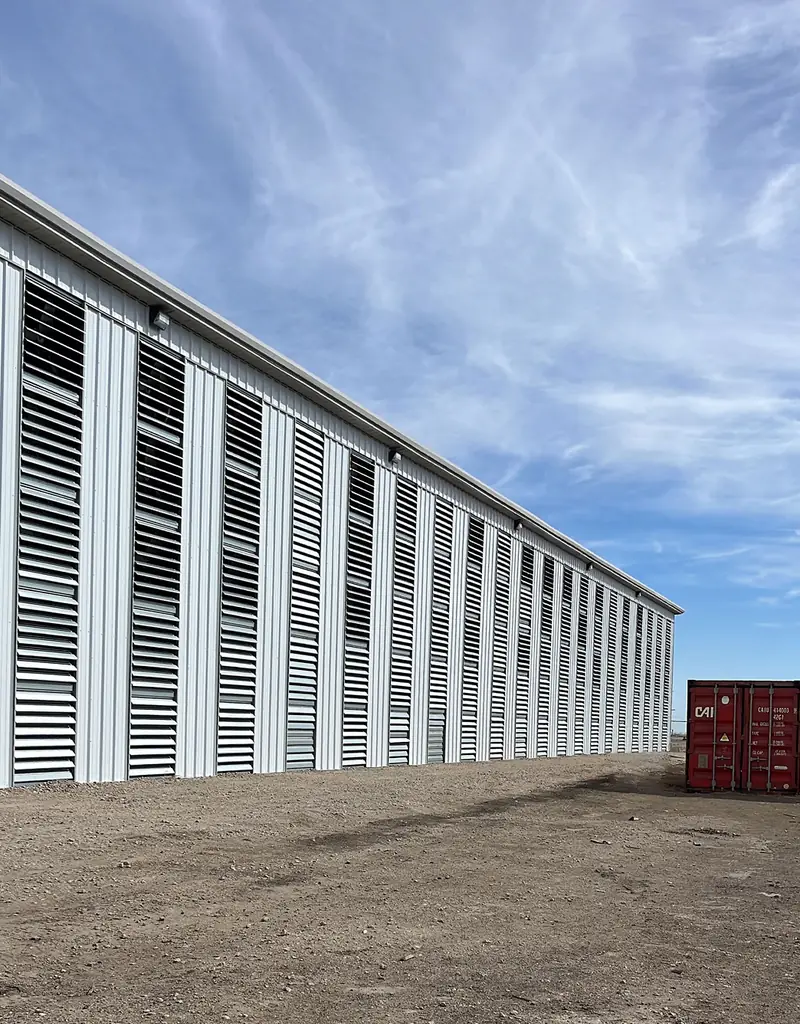
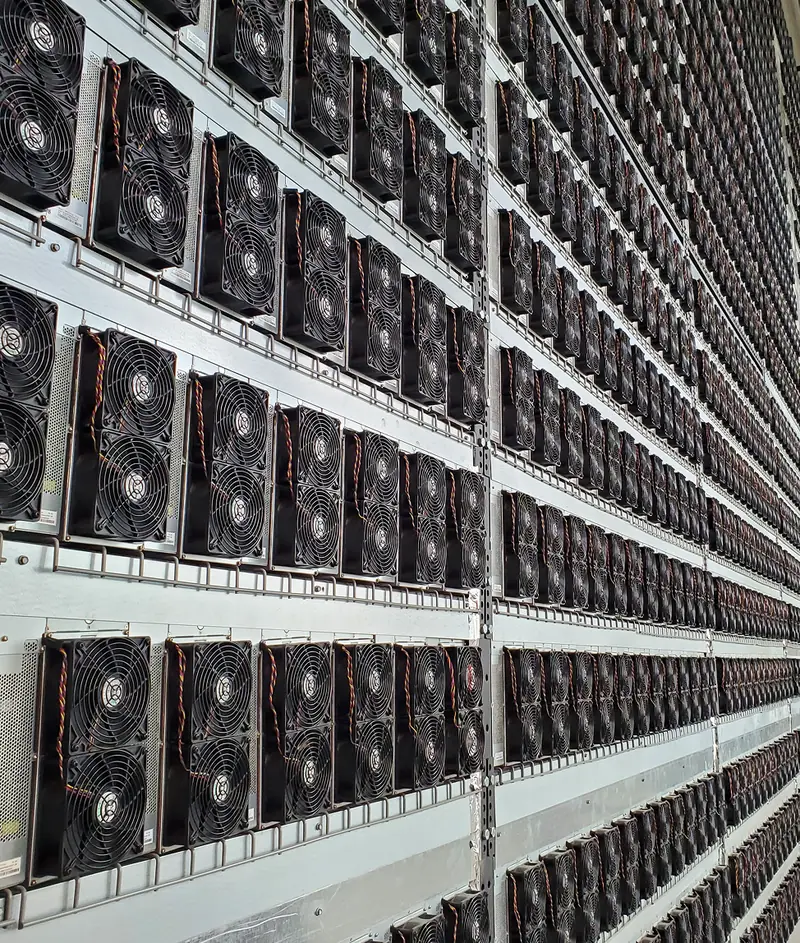
Mining sits where physical infrastructure meets software. One facility can hold several containers, racks and thousands of ASIC miners, all running inside fixed power and network limits.
Technicians don't think in fields and tables. They think in sites, containers and racks, in how fast power can change, and in which devices can see which miners.
That creates two recurring needs for technicians and operations teams:
Facility Settings
Where it started
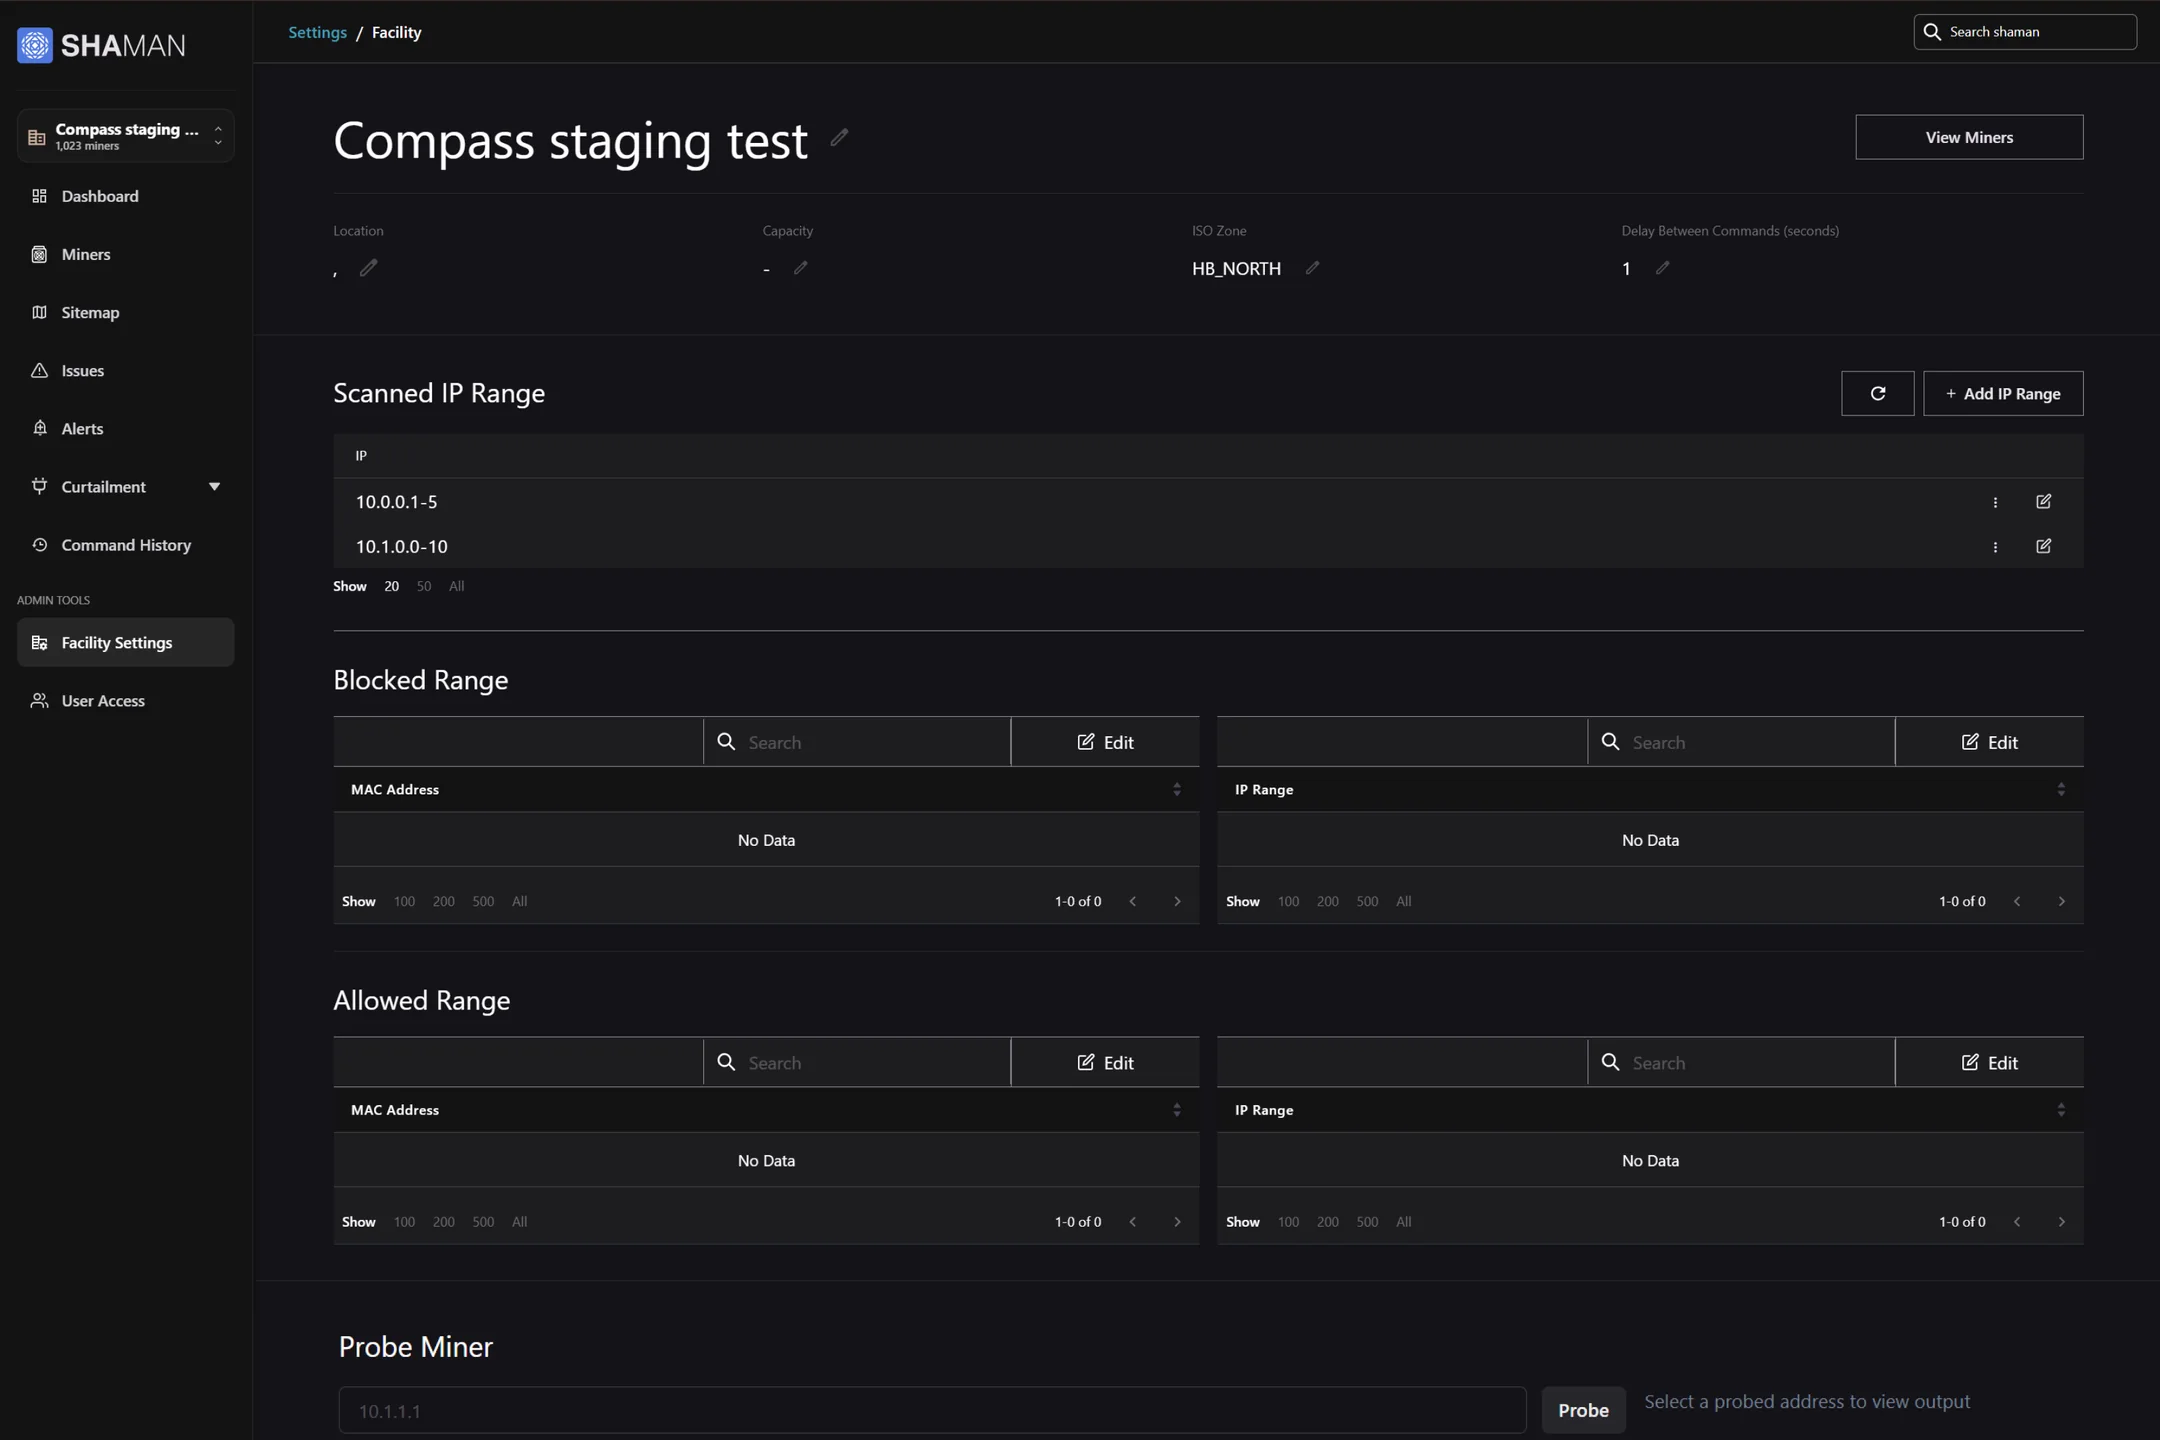
The old page showed a handful of values in a single row, and split network rules into separate MAC and IP tables that were clunky and difficult to digest at a glance. Certain controls on the backend were already supported, such as ramp behaviour and device assignment, but they had no place on the interface.
Issues overview
The problem
The opportunity was therefore to make facility issues more visible, measurable, and actionable—from identifying problem areas to monitoring whether operational improvements were actually working.
A facility can contain multiple containers or buildings, with miners organized across racks within each space. At the scale of thousands of miners, issues are inevitable—but the challenge is identifying where problems are concentrated, which ones matter most, and whether they are improving over time.
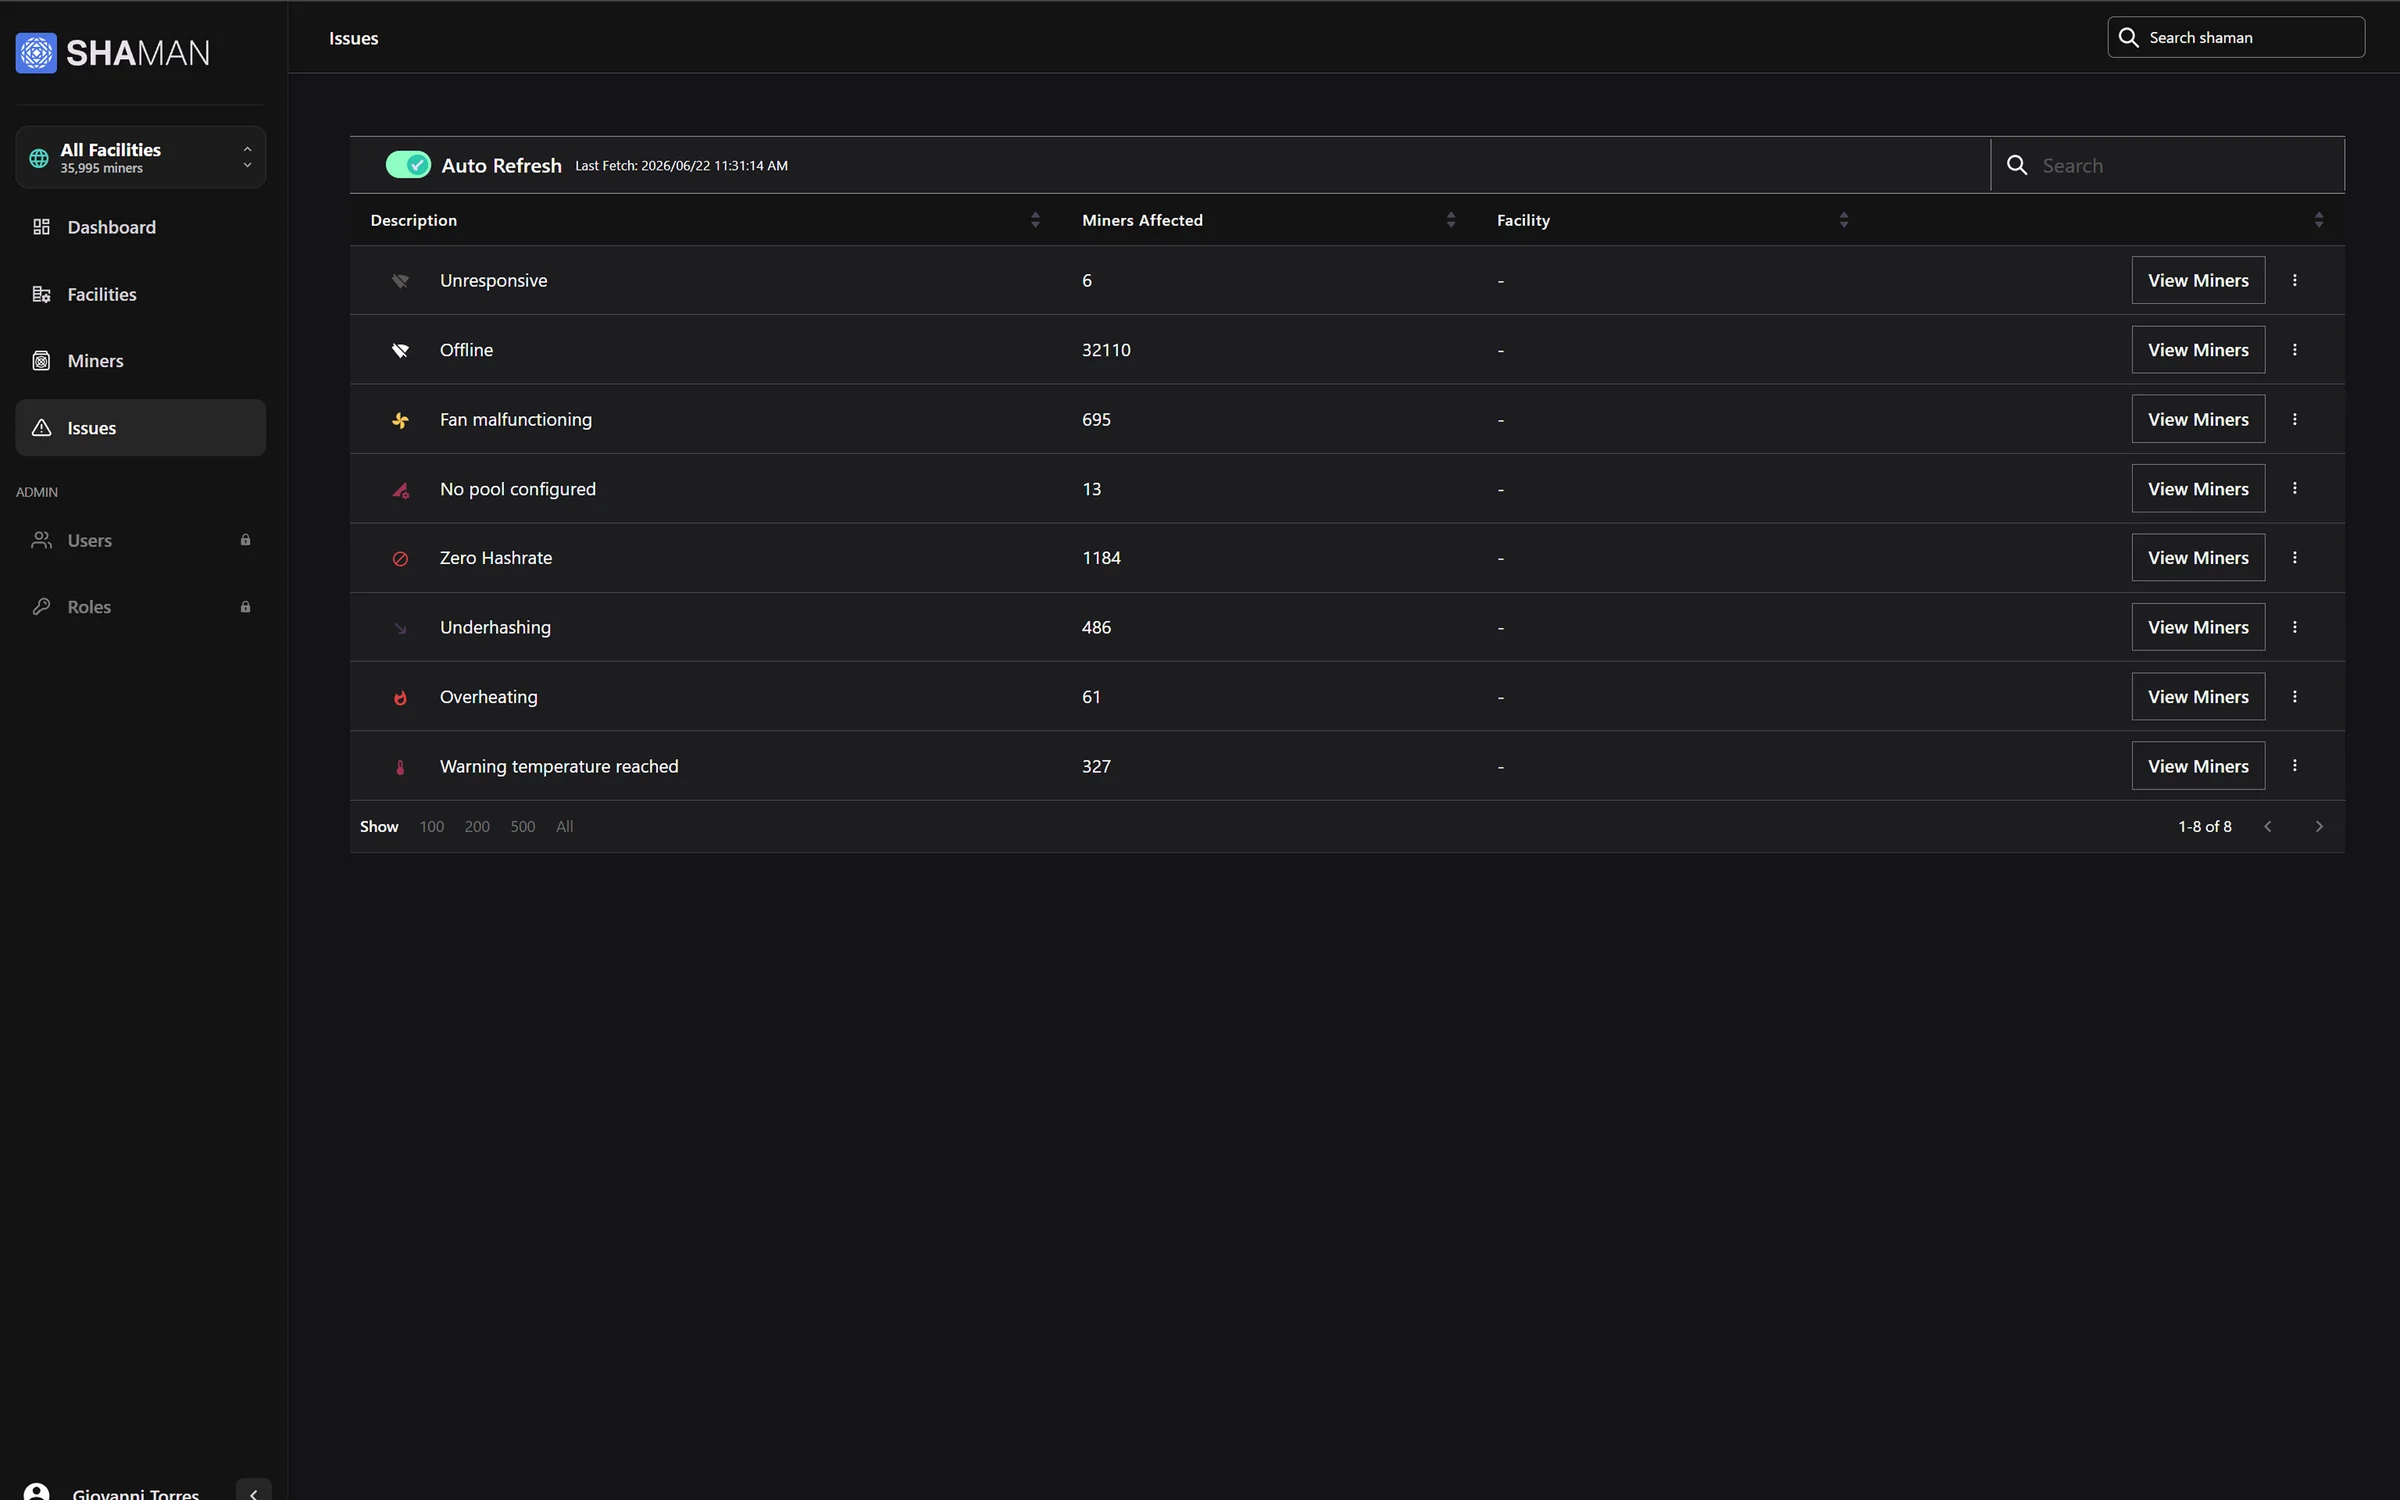
The previous experience made this difficult. It provided limited visibility into issue distribution, showing only issue counts. Key information such as the location of each issue and its overall impact on the facility was missing, while there was no historical view of individual issue types. This meant teams could identify which issues occurred most frequently, but had little context for understanding where they were happening, whether they were recurring, or whether interventions were actually reducing them.
For example, after installing new fans or upgrading cooling systems in a facility building, there was no straightforward way to track overheating issues before and after the intervention and determine whether the upgrade had actually reduced their occurrence.
Which issue types are active, how many, and how severe.
Which facilities, and which containers inside them.
Whether issues are rising or falling against the norm.
Total, critical and warning counts each show their change against the 30-day average, so a number reads as good or bad at a glance.
Each issue type is ranked, coloured by severity and links straight to the affected miners.
Facilities are listed with their issue mix as compact chips. Expanding a facility breaks its issues down by container, with a link to that container on the sitemap.
Stacked bars compare issue mix across facilities, a health chart shows the share of miners without issues, and the trend shows each issue type over time against its one-month average.

Reflections
Technicians make better changes when the facility's constraints are on screen first. Context turned settings from guesswork into decisions.
Labelling system-calculated values as estimates kept the interface truthful about what operators control and what follows from it.
“A problem isn't useful until someone can walk to it.”
Linking issues to facilities, containers and the sitemap mattered as much as counting them.
Counting issues showed what was breaking. Showing where they clustered and how they changed over time showed whether a fix, like new cooling, actually worked.
Other case studies